Start Learning!
Beginner's Journey
Everything we do, from how we get up in the morning to how we go to bed at night is a process. So even if you’ve never heard the phrase process improvement before, you know more than you think.
To help you tap into the world of process improvement, let’s take a quick trip that begins with what it is, why it’s important, keys to success, what to expect, a glossary, and which legal aids have already begun their PI journey.
Step 1: What is Process Improvement?
Download Full PDF
It is the practice of identifying, analyzing and improving existing processes.
You have lots of processes, big and small, you use all the time to get through your day. Do you always shower at night and lay your clothes out for the next day? That’s a process. When you are working from a recipe do you assemble all the ingredients before starting? Do you wash your bowls and utensils as you go? Those are processes. What about this process for assembling furniture?
This can involve several different items to make in a short period of time, and who wouldn’t want to save time and be better prepared to finish a piece of furniture?
There are several learning points to bringing process improvement ideas home. When assembling furniture (the work lessons are in parentheses):
- Assemble the furniture as close as possible to where it finally sits (Don’t deviate from your goals). Obvious as it sounds, I have suffered in the past by having to move large pieces of finished furniture from one side of the room to the other.
- Make sure you have all the parts BEFORE you begin the assembly (Plan well before you begin the project). What if you are 70% done and realize that you are missing a cam screw or a specialized screw? It’s better to know that in advance so that you’re not waiting for replacements to arrive via mail next week.
- If any additional tools will save you time, get them (Look for tools and methods to increase efficiency). Those Allen wrenches work great, but if you have scores of screws to tighten, an electric drill with the appropriate bit will come in very handy.
- Read the instructions. Visualize in your mind how the final piece will look like (Use the procedures in place and understand your final state). Don’t skip steps. That could mean rework, unscrewing, unfastening and lots of wasted time and energy. Understand how these steps will lead to the finished product.
- Keep everything close (Don’t deviate from your plan). Arrange your tools, parts, screws, nuts and bolts close so that you are not wasting time running around to get what you need. Also don’t be in a position where you are searching for things that might have gone under the packaging or containers.
Read: How Can Process Improvement Ideas Be Used at Home?
At work, process improvement can help optimize organizational performance, achieve best practice standards, enhance quality and increase the quantity of services and improve the user experience for both your clients and for your co-workers.
Process improvement can have several different names such as business process management (BPM), business process improvement (BPI), business process analysis (BPA) business process re-engineering, continual improvement process (CIP), to name a few. Regardless of the nomenclature, they all pursue the same goal: to minimize errors, reduce waste, improve productivity and streamline efficiency.
There are also several different methodologies designed to help your program tackle process improvement. Each aims to help your organization identify process issues, fix them and analyze the success or failure of those changes.
Despite that common goal, each methodology suits a different need. There are a number of methods and a plethora of tools for process improvement. Most of them use acronyms or mnemonics to help remember the steps. It pays to keep the GLOSSARY handy!
Methods you may hear the most often about in legal aid:
Step 2: Why do Process Improvement?
Download Full PDF
In all organizations:
Despite the best of intentions, over time, and regardless of policies, protocols, checklists, or flow charts:
- processes get quick fixes or add-ons to accommodate new rules or requirements,
- human beings take shortcuts,
- people train their successors using their shortcuts,
- there is no training or insufficient training,
- things have changed since the last time anyone took a good look at a process from beginning to end
In process improvement, organizations discover how the process actually happens, not how it is supposed to happen or how it happens on paper. You uncover where those discrepancies between the ideal and the reality have crept into your process.
It’s one thing to map how the process works in the present, but after pinpointing problems and proposing solutions, you have the ability to re-map the process to what it should be.
In legal aid:
Effective process improvement (and a continuous improvement mindset) can a positive impact on any program’s capacity to help people. Here are two examples:
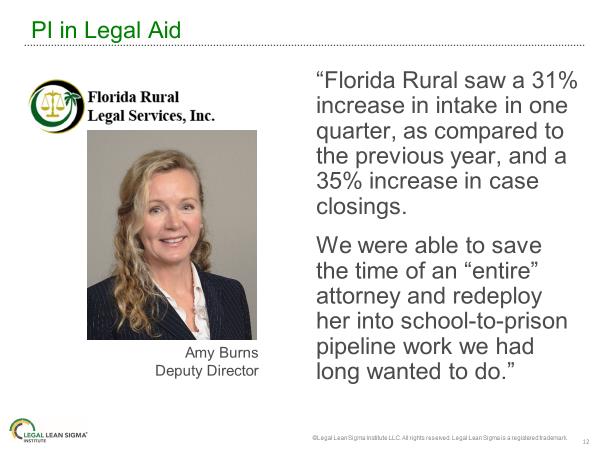
1. Florida Rural Legal Services
When applied to intake and case acceptance systems, process improvement can shorten the time for a caller to get the legal information or assistance he or she needs and it can
free up staff time, giving you an opportunity to redeploy your resources and increase advocacy.
That’s exactly the outcome LSC-funded Florida Rural Legal Services (FRLS) was able to achieve during its pro bono process improvement partnership with Toyota North America’s not-for-profit affiliate, the Toyota Production System Support Center (TSSC).
2. Kids in Need of Defense (KIND)
In 2011, Seyfarth Shaw LLP announced the completion of a one-year pro bono effort designed to streamline KIND’s operations and better equip its staff to carry out KIND’s mission to help unaccompanied immigrant children navigate the U.S. immigration system. The firm had adopted Lean Six Sigma methods internally in 2005, which was a new way of thinking about legal processes at the time—then began offering SeyfarthLEAN services to help legal departments and businesses run more efficiently.
Step 3: Keys to Success
Download Full PDF
You don’t need to be a subject matter expert in process improvement to contribute to your project’s success. In fact, the most important keys to success have nothing to do with process improvement experience or expertise.
Staff buy-in
It’s important to inform all staff when you decide to undertake a process improvement project. Sometimes staff members worry that a process improvement project may end up in a blaming situation or in eliminating positions. One way to address those concerns is sharing with the entire staff what process improvement is, why some legal aid programs have embraced it, why your program is undertaking it, the benefits other legal aids have achieved and those you hope to achieve--before you get started.
Once your program has begun its project, provide periodic opportunities to share progress, answer questions and address concerns with all staff. Process improvement involves change and can touch or impact many staff members duties.
Leadership support
While CEOs or Executive Directors do not usually serve on a Process Improvement project team it is critical that they support the undertaking. It is also important that leadership understands and supports the time commitment staff will be making--and is willing to trust and empower the project team to analyze processes, identify pain points and develop and test solutions. Conversely, program leadership should be kept informed, be prepared make necessary executive-level decisions when called upon to do so and be willing to serve as a program-wide cheerleader for the project.
Collaboration
Process improvement activities require a collaborative approach to succeed, and the need for a cohesive and effective multidisciplinary team is critical for positive outcomes. Many levels and functions of the organization should be incorporated, especially the frontlines, i.e. those who work directly with callers, walk-ins, etc. at the earliest stages of entry into the intake system.
Diversity of perspective
Oftentimes in legal aid, memberships on projects teams or workgroups is exclusively or heavily weighted towards attorneys or those in supervisory, management or executive roles. In process improvement this kind of “imbalance” severely limits the diversity of perspectives in the room, undermines the likelihood of accurate process mapping and can diminish organizational buy-in.
Safe Space
Even when a more balanced group of staff has been brought together, attorney and supervisory members are often more outspoken in ways that can dominate the discussion to the detriment of others’ participation. Management hierarchies can also take its toll on the willingness of newer attorneys to speak up.
Finally, in multi-office programs, real or perceived “office” hierarchies may exist. For example, bigger offices, urban offices, or “central” offices may dominate smaller or more rural offices within the same program.
None of this is likely intentional. The attorneys and/or supervisors in the room may be totally unaware the impact their vociferousness may have on others. But it is a reality of human dynamics which requires acknowledging, a solid set of ground rules and supportive facilitation to overcome.
When multiple roles and offices are involved, it is critical to set ground rules, particularly those that create a safe space for more introverted participants and/or those who are not lawyers and/or not management. Diversity & equity of perspectives is absolutely critical to success.
Giving Feedback and Receiving Feedback
Providing specific and timely feedback in a clear respectful manner during process improvement is particularly important to the success of the project.
Most of us hesitate to give feedback for fear of offending someone or because we don’t want to be thought of as complainers. It’s also not easy to receive feedback about something that is part of your job or that is specific to your workgroup or team.
A process improvement project will help you exercise and improve your feedback skills, both giving and receiving. It may even be helpful to spend a little bit of time during the project team orientation to talk about when and how to give feedback.
In order to hear feedback, you need to listen to it. Don’t think about what you’re going to say in reply, just listen. This can be especially difficult for lawyers who operate in an adversarial system where it is their job to immediately rebut anything perceived as negative to their position.
Emotional intelligence will be essential. You need to be aware of your emotions (self-awareness) and also be able to manage them (self-control), so that even if the feedback causes an emotional response, you can control it.
Step 4: What to Expect
Download Full PDF
What to expect will depend upon:
- What role will you play in your process improvement project.
Are you the executive director, a project team member, a staff member directly impacted by any changes that will be made, a staff member indirectly impacted by any changes that will be made?
- The size and complexity of the process itself
Is it small in scope or is it large in scope? Is it how the phone gets answered or is it the entire intake or case acceptance process?
- The culture of the program,
how collaborative is it, how adaptable is it, how risk averse is it, how innovative is it?
- The wild card:
This is legal aid after all. There could be a natural disaster or pandemic, funding shifts, case management system conversation, leadership transition, technology meltdowns.
These are the elements that will generally determine how long and involved the project will be. It could take weeks. It could take months. And every project will be different because every projects’ elements will differ.
The best ways to know what to expect?
- Talk to other legal aid programs who have done a process improvement project about what they experienced, what they learned and what they would have done differently.
- Do your first project!!!
The good news is that process improvement uses proven methodologies that have long provided measurable benefits for businesses, law firms, nonprofits, and legal aid programs
The basic steps in process improvement--regardless of approach, tools or tactic--generally involve these 5 activities:
Initiate: Align & Commit
- Commit to doing process improvement and be clear about the purpose for doing it
- Identify the internal and external “stakeholders”
- Align around the approach to be used and acquire a basic understanding of it
- Make sure you have a program wide perspective, then put together and orient the project team
- Scope the Project and Develop your Project charter
Inquire: Understand the current or “as-is” state of the process
- Map the current process,
- identify the pain points,
- determine which among them are priorities in addressing
- Ferret out the root cause of the pain points you have chosen
- Look for the data you already have and determine the data you need to have for baseline metrics to measure progress.
Imagine: What is possible?
- Brainstorm solutions (make sure they address the root cause of the problem, not its symptoms)
- Develop a new process design and map it out
- Insure you have stakeholder understanding and support outside of the project team and program leadership
Innovation: Create the future
- Look at the process you have designed and consider your return on investment would be. Are the benefits the program and/or its clients will receive worth the cost and effort it will take?
- Communicate with internal and external stakeholders before initiating implementation.
Implementation: Actualize the Innovation
- Plan the Implementation Project and communicate about it
- Pilot the Process. Make the changes for an agreed upon period of time and observe, measure, and get feedback on how it works.
- Improve the process design by making the tweaks you need to make in real life and test some more.
- This is a good time to engage stakeholders. Get feedback on what you are imagining, invite them on to workgroups or to help testing.
Step 5: Glossary
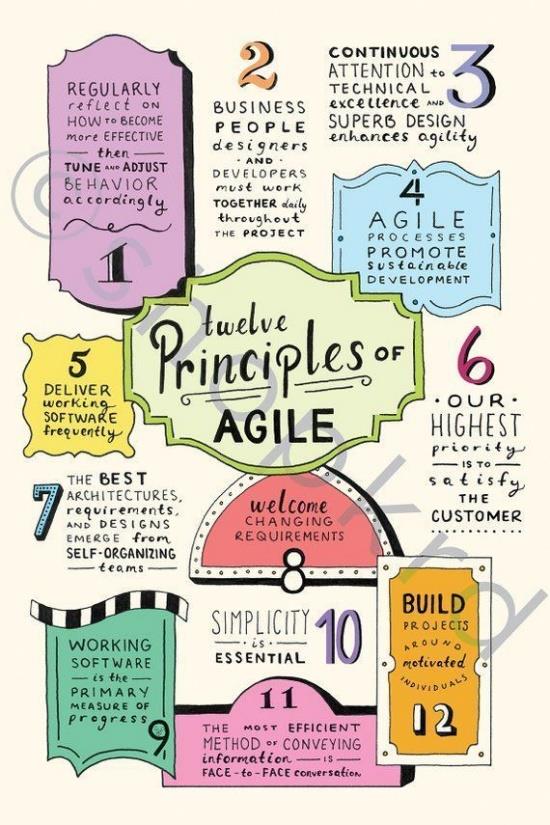
Download Full PDFAGILE
Agile is an iterative development method that values human communication and feedback, adapting to change, and producing working results.
Agile is iterative, meaning that it is done in pieces (sprints), with each sprint building and improving off the lessons from the previous sprint.
Agile is both an approach and a mindset.

ANDON
A “Visual Indicator” device that indicates the “Status” of a machine, line, or process. Frequently audible alarms or warning messages accompany Andon status lights as a secondary method of communicating a problem has arisen.
Andons are typically color-coded with these generic colors: –Green (normal operations)–Yellow (not running at rate, help needed, or in midst of changeover or planned maintenance)–Red (a problem occurred, the machine or line is stopped, and urgent attention is needed)
These colors with similar meanings are often used on spreadsheets, dashboards and in kanban to indicate: Done (green), in process (yellow) and not done (Red)

ANDON CORD
The Andon Cord is a concept that was introduced in Japanese factories following the Toyota Production System. It consisted of a pull cord or button that workers could activate to stop the production and warn management in case of a significant issue.
ATTRIBUTE
Qualitative data that can be counted for recording and analysis. These include characteristics of occurrence, or number of times/parts installed per cycle, etc.
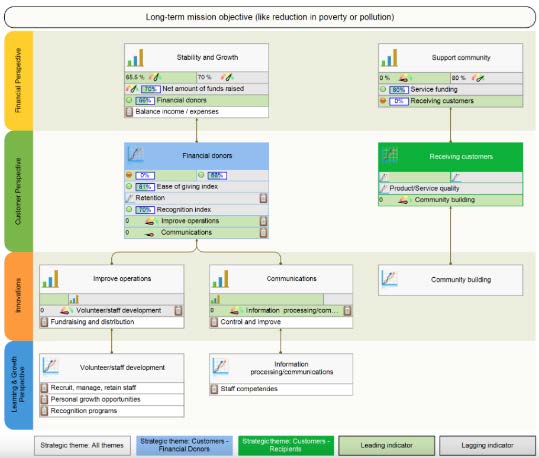
BALANCED SCORECARD
A management system that provides feedback on internal business processes and external outcomes to continuously improve strategic performance and results.
BENCHMARKING
The process of measuring products, services, and practices against those organizations known to be leaders in one or more aspects of their operations.
BLACK BELT
Trained in Six Sigma and Lean principles, Black Belts lead teams responsible for measuring, analyzing, improving, and controlling key processes that influence customer satisfaction and/or productivity growth. Black belts train and coach project teams and are full-time positions.
BLITZ
A blitz is a fast and focused process for improving some component of business: a product line, a machine, or a process. It utilizes a cross-functional team of employees for a quick problem-solving exercise, where teams focus on designing solutions to meet some well-defined goals.
BOTTLENECK
The slowest operation (choke point) in a manufacturing process. Do not confuse this with a company’s “constraint” taken from TOC (Theory of Constraints), which is the slowest operation in an entire manufacturing system that, if remedied, would increase overall company throughput.
For instance, you may have a bottleneck in the intake process but that does not mean it is slowest operation in your entire service delivery process.
BRAINSTORMING
A technique teams use to generate ideas on a particular subject. Each person on the team is asked to think creatively and write down as many ideas as possible. There are many approaches to, and tools for, brainstorming.
CALIBRATIONS
Comparison of a measurement standard or instrument of known accuracy with another instrument to detect, correlate, report, or eliminate by adjustment any variation in the accuracy of the item being compared to minimize errors.
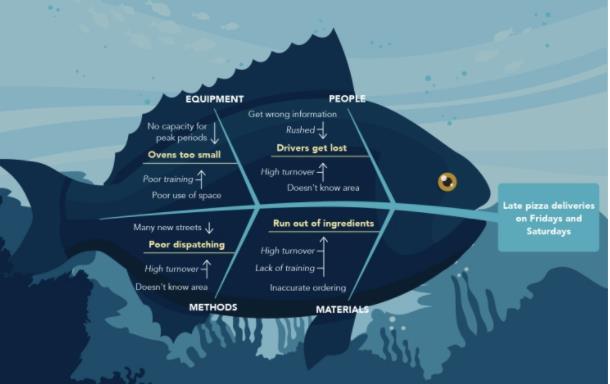
CAUSE AND EFFECT DIAGRAM
A visual problem-solving tool used to logically organize possible causes for a specific problem or effect by graphically displaying them in increasing detail. It helps to identify root causes and ensures common understanding of the causes. Also known as a fishbone or ishikawa diagram.
Read about a fishbone diagram here.
CHANGEOVER
Switching from producing one part/product to another, which could include installing a new plate in a printing unit of a press, new ink in the ink fountain, new software in a computer, and so on.
Or converting to a new case management system or adding a new screening question to intake
CHECK SHEET
A simple data recording device. The check sheet is custom designed by the user, which allows him or her to readily interpret the results. The check sheet is one of the “seven tools of quality.” The 7 tools were first emphasized by Kaoru Ishikawa, a professor of engineering at Tokyo University and the father of "quality circles."
List of the 7 tools of quality:
- Cause-and-effect diagram (also called Ishikawa or fishbone diagrams): Identifies many possible causes for an effect or problem and sorts ideas into useful categories.
- Check sheet: A structured, prepared form for collecting and analyzing data; a generic tool that can be adapted for a wide variety of purposes.
- Control chart: Graph used to study how a process changes over time. Comparing current data to historical control limits leads to conclusions about whether the process variation is consistent (in control) or is unpredictable (out of control, affected by special causes of variation).
- Histogram: The most commonly used graph for showing frequency distributions, or how often each different value in a set of data occurs.
- Pareto chart: A bar graph that shows which factors are more significant.
- Scatter diagram: Graphs pairs of numerical data, one variable on each axis, to look for a relationship.
- Stratification: A technique that separates data gathered from a variety of sources so that patterns can be seen (some lists replace stratification with flowchart or run chart).
COMPANY CULTURE
A system of values, beliefs, and behaviors inherent in a company. To optimize business performance, top management must define and create the necessary culture.
CONSTRAINT
Taken from the theory of constraints (TOC), a constraint is anything that limits a system from achieving higher performance versus its goal.
See also “Bottleneck”
CORRECTIVE ACTION
Actions taken to eliminate the cause of a detected nonconformance within a product, service, or quality management system and those measures taken by management to prevent its recurrence.
COST OF POOR QUALITY (COPQ)
The costs associated with providing poor quality products or services. There are four categories:
- internal failure costs (costs associated with defects found before the customer receives the product or service),
- external failure costs (costs associated with defects found after the customer receives the product or service),
- appraisal costs (costs incurred to determine the degree of conformance to quality requirements), and
- prevention costs (costs incurred to keep failure and appraisal costs to a minimum).
CURRENT STATE MAP
A value stream map of the process as it is currently being done in order to identify opportunities for reducing non-value-added activities and other sources of waste.
CYCLE TIME
The time it takes to do one repetition of any particular task typically measured from “start to start,” the starting point of one services’ processing in a specified operation until the start of another similar services’ processing in the same process. Looks similar to, but not the same as a “Balanced Scorecard”
DASHBOARD
A set of metrics, usually not more than five or six, that provides an “at-a-glance” summary of an organization’s or project’s status. Every participant in an organization/project—from the CEO to a factory floor worker—can have his or her own dashboard with function- and level-appropriate data summaries.
Check out LSNTAP video, Dashboards for Legal Aid,
CLAS’s 2Q2020 Impact Dashboard, and The Covid Tracking project’s Dashboard which is used as an example of COVID-19-related data tools by LSC at Tools and Visualizations for Accessing Data.
DESK AUDIT
An audit which is conducted of documentation only.
DISTRIBUTION
A distribution describes a population from which observations are drawn, categorized into cells, and forming identifiable patterns. It is based on the concept of variation that states that anything measured repeatedly will arrive at different results. These results will fall into statistically predictable patterns.
A bell-shaped curve (or normal distribution) is an example in which the greatest number of observations fall in the center with fewer and fewer observations falling evenly on either side of the average.
DMAIC
A Six Sigma structured problem-solving methodology: define, measure, analyze, improve, and control.
DOCUMENT CONTROL
Activities which ensure that the review, approval, issuance, amendment, retrieval, storage, and destruction of documentation and data are performed, providing recipients with only approved documents of the latest revision at all locations where they apply
EIGHT WASTES
The eight wastes are activities identified and categorized as non-value adding events or processes that limit efficiency or effectiveness-- or that serve as a barrier to an organizational goal such as: serving more clients, serving the same number of clients more holistically or allowing more attorneys to operate at the top of their license.
- Transportation = movement of the work. Manifestations include handoffs where the work is transferred from one person to another. Transportation of electronic files is particularly insidious because it frequently results in multiple, varying copies of the work, which must eventually be reconciled Transportation is also an opportunity for a defect when the work goes to the wrong person or fails to get to the right person.
- Inventory = Inventory is a common result of multi-tasking and otherwise un-balanced workloads. Inventory can be found in e-mail or work order in-boxes, to-do lists. If a person has three tasks to complete, it is guaranteed that two of them are waiting (in inventory) while that person performs the third.
- Motion = people moving or working without producing. Meetings are motion in the sense that they are work without producing, unless a decision is made, or information is produced during the meeting. Motion shows up as people search for files they can’t find, in phone calls to track down information, Most un-productive work takes place inside the electronic system while the person is sitting at his/her desk or while they are sitting in a meeting.
- Waiting = people waiting for information in order to do work. This is another common result of multi-tasking, and also the primary cause of multi-tasking. People work on other things while they wait for one thing to be processed and made ready. Unfortunately, when the one thing finally becomes ready, we tend to finish what we started before getting back to it. Because of multi-tasking, waiting is difficult to observe. It’s perhaps the most common and wasteful waste of them all in the office.
- Overproduction = producing unnecessary work or deliverables. Overproduction shows up in multiple copies of information, producing reports that aren’t read, reply all in emails, working on deliverables that aren’t important, and delivering the same information in multiple deliverables or formats.
- Over Processing = unnecessary effort to get the work done. Over Processing shows up in additional signature approvals, data entry or data format changes, frequently revising documents or information, or complex forms or databases that require information to be entered repeatedly. Over Processing often results from the creation of multiple versions of a piece of work, that now must be reconciled into the true work.
- Defects = any work that did not accomplish its purpose or was not correct the first time. Defects include late work, incorrect information, conflicting information, instructions that must be clarified, insufficient information, partially complete work or information, miss-named files, lost files or information, and anything that must be reworked. Rework is the pain that results from defects. Find the re-work and you will find the Defect waste.
- Underutilized People, Skills, and Ideas = capabilities of people that are not used or leveraged. This happens frequently in large organizations where the skills and backgrounds of everyone are not common knowledge. This can vary from not capturing ideas that employees might have for new products or innovations, to an attorney doing work a paralegal could do. The biggest crime in this category is not empowering or enabling the people most intimate with a process to improve the process.
Note: These eight wasters were taken from this page on the Lean Accountants website in order to use office examples versus manufacturing examples.
EXTERNAL CUSTOMER
People or organizations who receive a service, or information.
FIVE WHYS
A technique for discovering the root causes of a problem and showing the relationship of causes by repeatedly asking the question, “Why?” The technique uses repetitive questioning to probe deeper to surface the root cause of a problem. The number of times “why” is asked depends on when the true root cause is reached.
FLOW
A main objective of the Lean production effort, and one of the important concepts that passed directly from Henry Ford to Toyota. Ford recognized that, ideally, production should flow continuously all the way from raw material to the customer and envisioned realizing that ideal through a production system that acted as one long conveyor.
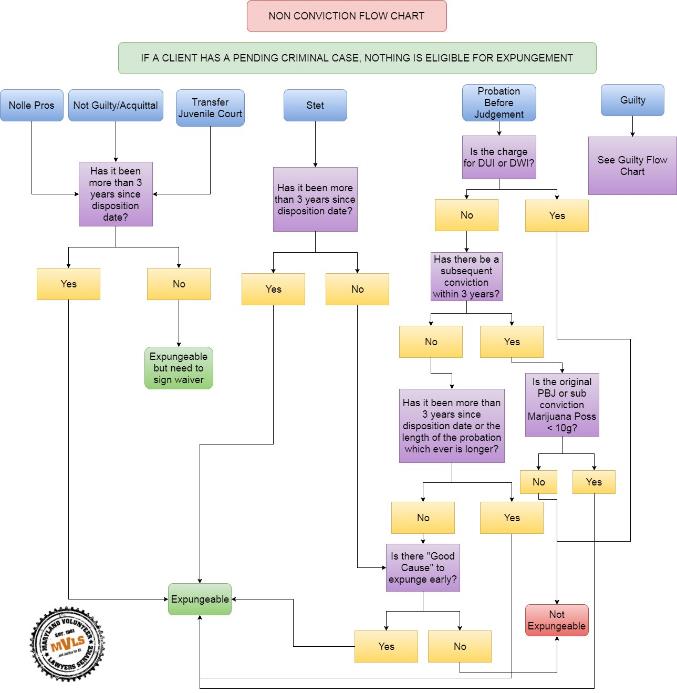
FLOWCHART
A graphical representation of the steps in a process. Flowcharts are drawn to better understand processes. One of the “seven tools of quality.”
FORCE FIELD ANALYSIS
A technique, developed by Kurt Lewin, for analyzing what aids or hinders an organization in reaching an objective. An arrow pointing to an objective is drawn down the middle of a piece of paper. The factors that will aid the objective’s achievement, called the “driving forces,” are listed on the left side of the arrow. The factors that will hinder its achievement, called the “restraining forces,” are listed on the right side of the arrow.
FUNCTIONAL LAYOUT
The practice of grouping activities by type of operation performed.
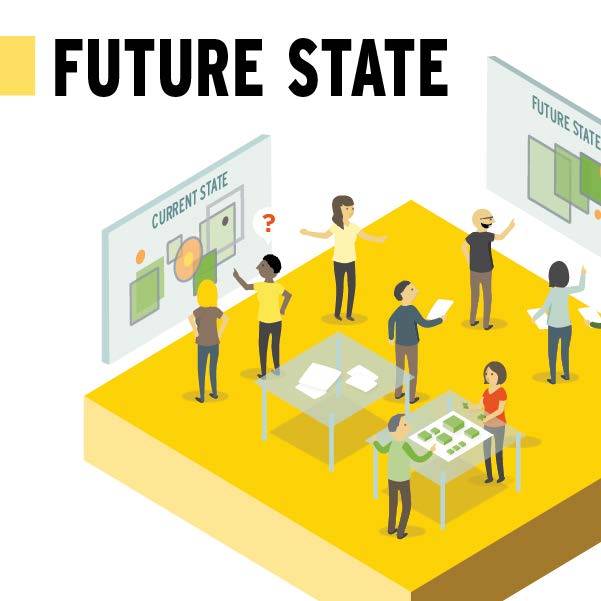
FUTURE STATE MAP
A blueprint for Lean implementation. Your organization’s vision, which forms the basis of your implementation plan by helping to design how the process should operate. The future state map deploys the opportunities for improvement, identified in the current-state map, to achieve a higher level of performance at some future point. Present state is where we are now. Future state is where we want to be.
Visit the Future State link here.
GENCHI GEMBUTSU and GEMBA
A Japanese term meaning “Go and See,” It suggests that in order to truly understand a situation one needs to go to the “real place” – where work is done – and observe.
The term Gemba in this context means “the actual place where the work is being performed”
It’s important to note that the purpose of the Gemba walk isn’t to correct or shame people who aren’t following the process exactly. Gemba walks are meant to bring teams closer together and improve processes by identifying problems at the source.
GREEN BELT
Green Belts are trained on basic Six Sigma improvement methodology and will lead a process improvement or quality improvement team as part of their full-time job. Green Belts are coached by Black Belts.
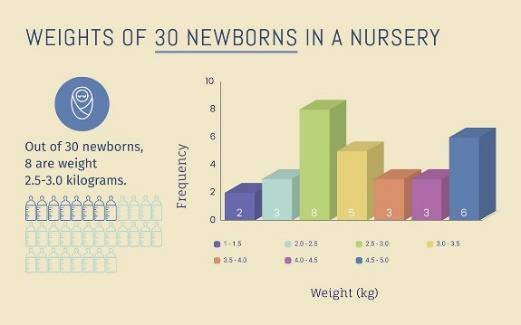
HISTOGRAM
A graphic summary of variation in a set of data. The pictorial nature of a histogram lets people see patterns that are difficult to detect in a simple table of numbers. One of the “seven tools of quality.”
Read more about creating histograms here.
INSPECTION
A verification activity. For example, measuring, examining, testing, and gauging one or more characteristics of a service and comparing the results with specified requirements to determine whether conformity is achieved for each characteristic.
INTERNAL CUSTOMERS
Employees or departments who receive output in the form of a service, or information from other employees or departments within the organization.
INTERNAL QUALITY AUDIT
A documented activity performed to verify, by examination of objective evidence, that applicable elements of the quality system are suitable and have been developed, documented, and effectively implemented in accordance with specified requirements.
JUST-IN-TIME (JIT)
JIT is a system for producing and delivering the right items at the right time, in the right amounts. The key elements of JIT are flow, pull, standard work, and takt time. Principles that are fundamental to time-based competition include waste elimination, process simplification, set-up and batch-size reduction, parallel processing, and layout redesign. organization.
JIDOHKA
Stopping a line automatically when a defective part is detected. Any necessary improvements can then be made by directing attention to the stopped equipment and the worker who stopped the operation. The jidohka system puts faith in the worker as a thinker and allows all workers the right to stop the line on which they are working. This really speaks to the importance of empowering frontline workers, from receptionists and intake workers to newer attorneys, as decision makers. See also Andon cord.
KAIZEN
KAI (to modify, to change) + ZEN (think, make good, make better) = KAIZEN
Non-value-added waste exists everywhere. Kaizen refers to the series of activities whereby instances of waste are eliminated one by one at minimal cost, by workers pooling their wisdom. The whole secret to Kaizen is to create an atmosphere, a culture of continuous improvement, by focusing people on problems. In short, Kaizen means continuous improvement through incremental improvement.
KANBAN
A Japanese term. The actual term means “signal”.
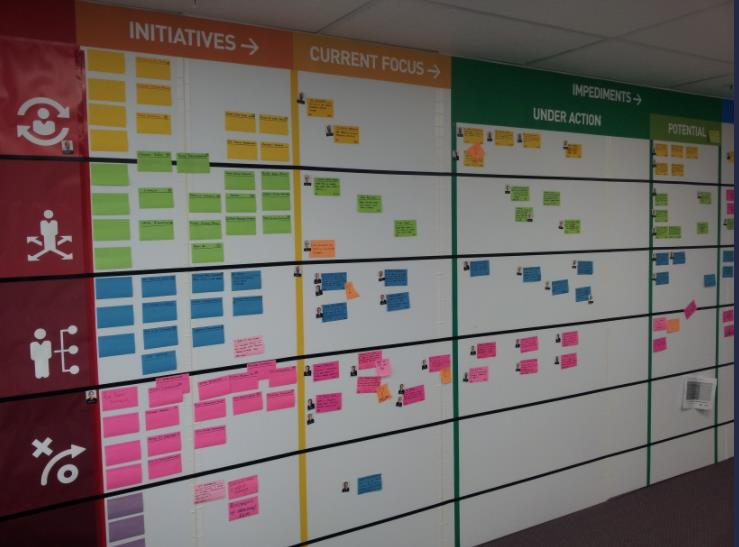
KANBAN BOARD
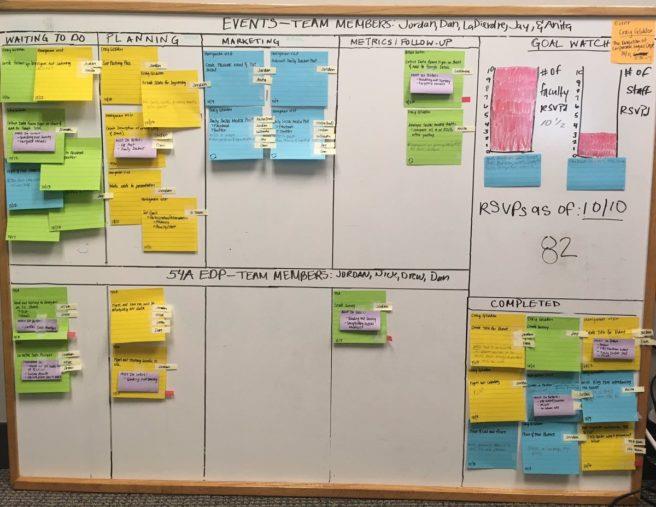
MSULaw LegalRnD Lab law student projects Kanban board.
A Kanban board is segmented into derivations of three basic columns, called “lanes”: (1) To Do; (2) Doing; (3) Done. The lanes can be renamed to fit the needs of the project. To learn more about Kanban, visit everydaykanban.com.
The great thing about a Kanban system is that it can be tailored to the needs of any project or organization. The goals for this Kanban system were to keep law student teams:
- On track — ensure that tasks are completed on time; minimize the work in process; understand the dependencies of each task.
- Organized — inform everyone about which tasks are due, overdue, and done; who is responsible for each task; which phase or phases of our project we are in.
- Empowered — reduce the number of instances where team members feel overwhelmed; promote work satisfaction and morale.
- Motivated — create a drive to perform, and pride in accomplishing a goal; and
- Accountable — create a sense of ownership of a task and responsibility to the team
Kanban for Law: How I Use Kanban to Manage LegalRnD Projects
KEY PERFORMANCE INDICATOR (KPI)
A statistical measure of how well an organization is doing in a particular area. KPIs are metrics that can evaluate the successes and shortcomings of an organization. In the case of legal aid organizations, common examples might include the number of new clients per month, types of legal cases, and tracking the average income of each applicant. However, there are no limits to the KPIs you can use. The most effective KPIs are those that are designed, implemented, and analyzed with your specific organization in mind.
LEAN
Business processes focused solely on providing customer-defined value while eliminating all waste activities associated with production and administration activities.
"Lean sits well with anything people do, legal services included. Lean is basically looking at your processes for getting legal work done, and separating each task into two categories:
Things that add value to the customer or client.
Things that don’t add value, which in the lean system are called waste."
The objective of lean is to remove the waste to focus on the processes that add value."
Specify what creates value from the client’s perspective."
Seyfarth Shaw, a large firm founded in 1945 and headquartered in Chicago created SeyFarthLEAN to provide clients services that combine the principles of Lean Six Sigma with robust technology, knowledge management, process management techniques, alternative fee structures, and practical tools. SeyfarthLEAN began doing pro bono process improvement projects with legal aid programs as early as 2011 and has done process improvement training and projects in Illinois, Florida, and Minnesota.
MASTER BLACK BELT
Master Black Belts are Six Sigma Quality experts that are responsible for the strategic implementations within an organization. A Master Black Belt’s main responsibilities include training and mentoring of Black Belts and Green Belts; helping to prioritize, select and charter high-impact projects; maintaining the integrity of the Six Sigma measurements, improvements and tollgates; and developing, maintaining and revising Six Sigma training materials.
NON-CONFORMANCE
A non-conformance means that something went wrong – a problem has occurred and needs to be addressed. Non-conformances are addressed with corrective actions.
NON-VALUE ADDED
Activities or actions taken that add no real value to the product or service making such activities or action a form of waste.
NORMAL DISTRIBUTION
Normal distribution is the spread of information (such as product performance or demographics) where the most frequently occurring value is in the middle of the range and other probabilities tail off symmetrically in both directions. Normal distribution is graphically categorized by a bell-shaped curve,
PARETO DIAGRAM
Focuses on efforts or the problems that have the greatest potential for improvement by showing relative frequency and/or size in a descending bar graph. “80/20 Principle” or Pareto’s Law. The mathematical formula he used to demonstrate a grossly uneven but predictable distribution of wealth in society where- 80% of the wealth and income was produced and possessed by 20% of the population. Using resource development, an example might be:
- 80% of the funding comes from 20% percent of our donors
- 80% of our total volunteer hours comes from 20% of our volunteers
- 80% of our corporate sponsorships come from 20% of our industry/business relationships
PDCA (PLAN, DO, CHECK, ACT)
The PDCA Cycle is a systematic series of steps for gaining valuable learning and knowledge for the continual improvement of a product or process. Also known as the Deming Wheel, or Deming Cycle, the concept and application was first introduced to Dr. Deming by his mentor, Walter Shewhart of the famous Bell Laboratories in New York.
- Plan: This involves identifying a goal or purpose, formulating a theory, defining success metrics and putting a plan into action.
- Do: The components of the plan are implemented, such as making a product.
- Check: Outcomes are monitored to test the validity of the plan for signs of progress and success, or problems and areas for improvement.
- Act: This step closes the cycle, integrating the learning generated by the entire process, which can be used to adjust the goal, change methods, or even reformulate a theory altogether.
These four steps are repeated over and over as part of a never-ending cycle of continual improvement.
POKA-YOKE
Japanese approach to “mistake proofing” in all aspects of manufacturing, customer service, procurement, etc. It employs visual signals that make mistakes clearly stand out from the rest, or devices that stop an assembly line or process if a part or step is missed. (See also Andon Cord)
PREVENTION
A future-oriented strategy that improves quality by directing analysis and action toward correcting the production process. Prevention is consistent with a philosophy of continuous or never-ending improvement.
PREVENTIVE ACTION
Pro-active action taken to eliminate the cause(s) of a potential nonconformity or other undesirable or unsafe situation in order to prevent occurrence.
PROCESS
The combination of people, machine and equipment, raw materials, methods, and environment that produces a given product or service.
PROCESS CAPABILITY
The measured, built-in reproducibility or consistency of the product or service turned out by the process. Such a determination is made using statistical methods.
PROCESS IMPROVEMENT
Actions taken to increase the effectiveness or efficiency of a process in meeting specified requirements.
PROCESS MANAGEMENT
The cycle of continuous review, re-examination, and renewal of fundamental work processes that contribute to an organization’s performance and productivity. Itself a continual process, process management must at all times challenge a process’s fit with other processes and may result a in radical change to work methods and practices.
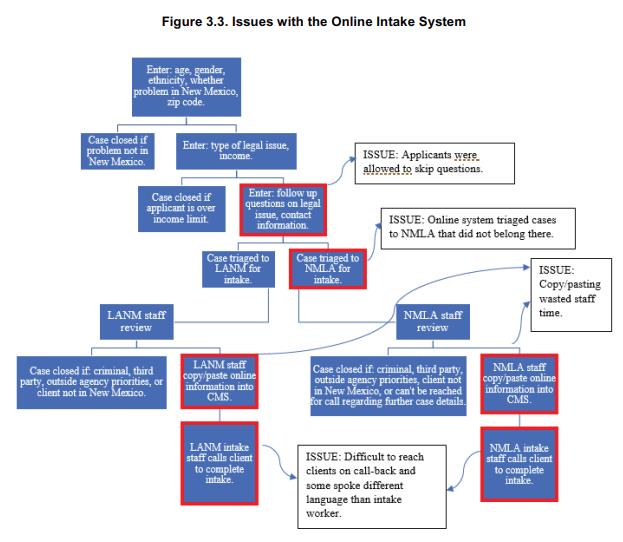
PROCESS MAP
New Mexico Online Intake System
QUALITY
Term that describes the condition which exists when a product’s or services’ performance and/or characteristics satisfy the stated or implied needs of the customer or client.
QUALITY MANAGEMENT
Activities which include strategic planning, allocation of resources and systematic activities for quality assurance such as planning, operations, and evaluation. These activities are the responsibility of senior management.
QUALITY POLICY
An organization’s general statement of its beliefs about quality, how quality will come about, and its expected result.
QUALITY RECORDS
All forms and records which exist as a result of a process and serves as evidence that the product or service meets the specified requirements. Records may be in the form of hard copy or electronic media.
QUALITY SYSTEM
The organizational structure, responsibilities, procedures, processes, and resources for implementing quality management.
QUALITY SYSTEM DOCUMENTS
Quality manual, system procedures manual, work instruction manual, and forms which are used to define the manner of production where their absence would adversely affect quality.
QUEUE TIME
The time a staff member or client spends in a line awaiting the next step, form, piece of information, permission, review, revision, decision etc.
RANDOM CAUSE
A source of variation which is random. A change in the source will not produce a highly predictable change in the response e.g., a correlation does not exist. Random variation cannot be economically eliminated from a process.
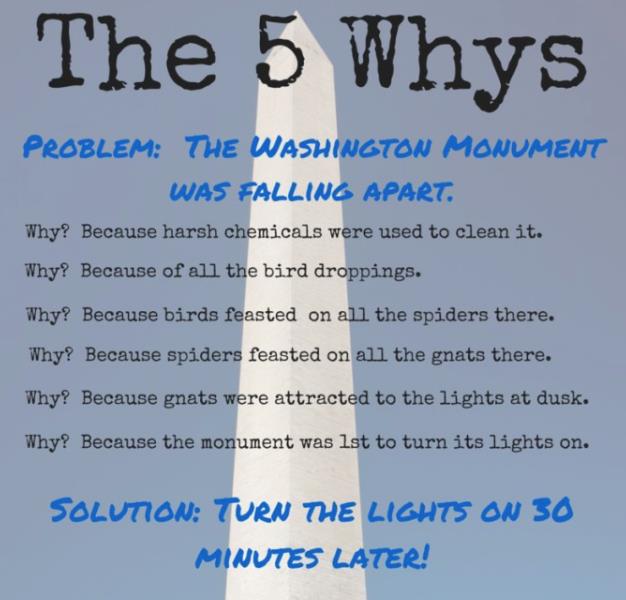
ROOT CAUSE ANALYSIS
A problem-solving methodology that focuses on resolving the underlying problem instead of applying quick fixes that only treat immediate symptoms of the problem. A common approach is to ask why five times – each time moving a step closer to discovering the true underlying problem. Root cause analysis helps to ensure that a problem is truly eliminated by applying corrective action to the “root cause” of the problem.
A classic “Five Whys” example.
SAMPLE
One or more individual events or measurements selected from the output of a process for the purpose of identifying characteristics and performance of the whole.
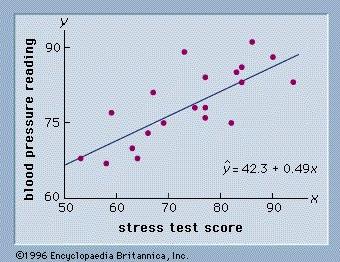
SCATTER DIAGRAM
A graphical technique to analyze the relationship between two variables. A scatter diagram is primarily used when you want to determine if a pair of numerical data points have a cause-and-effect relationship with each other. A scatter diagram is effective at showing a relationship because it does a good job of showing the range of data points at any section. If we were to use a bar or line chart, the best we could derive would be the trend of the data. We would miss out on a lot of other potential insights. Two sets of data are plotted on a graph, with the y-axis being used for the variable to be predicted and the x-axis being used for the variable to make the prediction. One of the “seven tools of quality.”
SENIOR MANAGEMENT
A team of individuals at the highest level of organizational management who have the day-to-day responsibilities of managing a company or corporation (CEO, CFO, COO, Executive Director, Deputy Director)
SENSEI
The Japanese term for “teacher”. An outside master or teacher that assists in implementing Lean practices. The sensei must be an easily understood and inspiring.
SEVEN TOOLS OF QUALITY
Tools that help organizations understand their processes in order to improve them. The tools are the cause and effect diagram, check sheet, control chart, flowchart, histogram, Pareto chart, and scatter diagram.
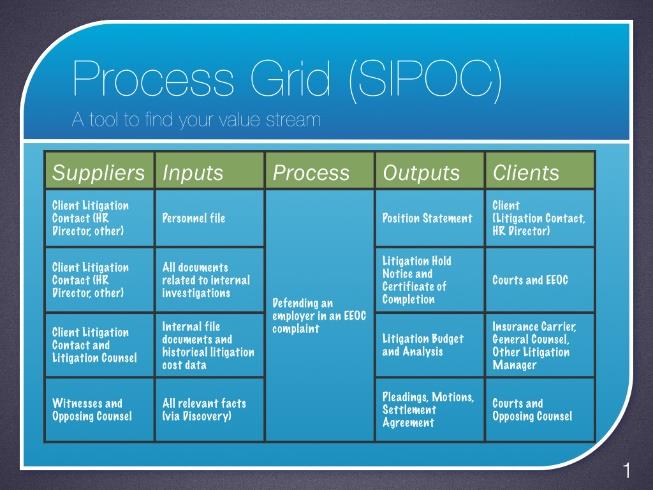
SIPOC DIAGRAM
A tool used by process improvement teams to identify all relevant elements (i.e., suppliers, inputs, process, outputs, customers) of a process improvement project before work begins.
Inside a Legal Process Improvement Project
SIX SIGMA
Six Sigma is a methodology that provides businesses with the tools to improve the capability of their business processes. This increase in performance and decrease in process variation leads to defect reduction and vast improvement in profits, employee morale and quality of product.
SPECIAL CAUSE
A source of variation that is intermittent, unpredictable, unstable, sometimes called an assignable cause. Usually evident by a point beyond the control limits. See also random.
STANDARDIZE WORK
Establishing precise procedures for each operator’s work in a production process, based on three elements:
Standardized work, once established and displayed, is the object of continuous improvement through kaizen. The benefits of standardized work include documentation of the current process for all, reductions in variability, easier training of new staff and a baseline for improvement activities.
STRATEGIC PLANNING PROCESS
Process whereby goals are set through internal and external assessment and deployed to resources for performance and improvement activities.
STRATIFICATION
The process of classifying data into subgroups based on characteristics or categories.
SUB-OPTIMIZATION
A condition where gains made in one activity are offset by losses in another activity or activities, created by the same actions creating gains in the first activity.
THEORY OF CONSTRAINTS (TOC)
A management philosophy and a set of tools for organizational change. TOC concentrates on improving services by removing or managing constraints to improve throughput, while Lean focuses on the identification and removal of waste to improve the flow of value. Both Lean and TOC emphasize improving the whole system rather than individual parts.
THROUGHPUT TIME
The time required for a process to proceed from inception to delivery. For example, it might be the time from the first phone call from a potential client until the time he or she receives a service.
TOTAL PRODUCTIVE MAINTENANCE (TPM)
A set of techniques, originally pioneered by Denso in the Toyota Group in Japan, to ensure that every piece of equipment (computers, printers, copiers, scanners, phone systems etc.) in a process always is able to perform its required tasks.
The approach is termed total in three senses. First, it requires the total participation of all employees, not only maintenance personnel but line managers, manufacturing engineers, quality experts, and operators. Second, it seeks total productivity of equipment by focusing on all of the six major losses that plague equipment: downtime, changeover time, minor stops, speed losses, scrap, and rework. Third, it addresses the total life cycle of equipment to revise maintenance practices, activities, and improvements in relation to where equipment is in its life cycle.
Unlike traditional preventive maintenance, which relies on maintenance personnel, TPM involves operators in routine maintenance, improvement projects, and simple repairs. For example, operators perform daily activities such as lubricating, cleaning, tightening, and inspecting equipment.
TOTAL QUALITY MANAGEMENT
A management approach in which all departments, employees, and managers are responsible for continuously improving quality so that products and services meet or exceed customer expectations. The Total Quality Control (TQC) methodology relies on the plan-do-check-act (PDCA) cycle to manage processes and, when problems arise, statistical tools to solve them. The methodology and tools are used often by employees during kaizen activities and together form an important subsystem of Lean.
TREE DIAGRAM
A management tool that depicts the hierarchy of people, tasks and/or subtasks needed to complete an objective. The finished diagram bears a resemblance to a tree. An organizational chart is a form of tree diagram.
TRENDS
The patterns that feature the continued rise or fall in a series of points. Attention should be paid to such patterns when they exceed a predetermined number.
VALUE
A product or service provided to a customer at the right time at an appropriate price, as defined in each case by the customer. In Lean thinking, an activity or process has value to a customer only if it is willing to pay for it.
VALUE PACKAGE
A total package of products and services that we offer to customers. This package might include short wait times, excellent service, and high service quality to ensure a great user experience and high client satisfaction and retention.
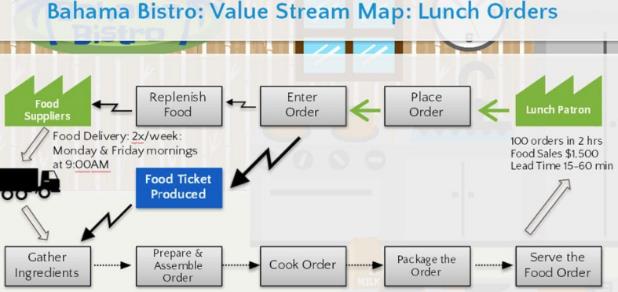
VALUE-STREAM MAPPING
A simple diagram of every step involved in the material and information flows needed to bring a product from order to delivery. Value-stream maps can be drawn for different points in time as a way to raise consciousness of opportunities for improvement. A current-state map follows a product’s path from order to delivery to determine the current conditions. A future-state map deploys the opportunities for improvement identified in the current-state map to achieve a higher level of performance at some future point.
In some cases, it may be appropriate to draw an ideal-state map showing the opportunities for improvement by employing all known Lean methods including right-sized tools and value-stream compression.
VARIATION
Variation is the inevitable fluctuation in process output. It is quantified by standard deviation, a measure of the average spread of the data around the mean. The sources of variation are grouped into two major classes: common causes and special causes.
VISUAL MANAGEMENT
Systems that enable anyone to immediately assess the current status of an operation or process at a glance, regardless of their knowledge of the process. Visual displays relate information and data to employees in an area through the use of charts, graphs, and process documentation. See also Kanban boards
WASTE
Any activity that consumes resources but creates no value for the customer.
YELLOW BELT
A Yellow Belt typically has a basic knowledge of Six Sigma, but does not lead projects on their own, as does a Green Belt or Black Belt. Is often responsible for the development of process maps to support Six Sigma projects. A Yellow Belt participates as a core team member or subject matter expert (SME) on a project or projects. In addition, Yellow Belts may often be responsible for running smaller process improvement projects using the PDCA (Plan, Do, Check,
Act) methodology. PDCA, often referred to as the Deming Wheel, enables Yellow Belts to identify processes that could benefit from improvement. These smaller Yellow Belt projects often get escalated to the Green Belt or Black Belt level where a DMAIC methodology is used to maximize cost savings using Statistical Process Control.
YIELD
Produced product compared to scheduled product.
Step 6: Map of Process Improvement Legal Aids
Know a legal aid program that should be on this map? Let us know.Intake
Other

Let's share together.

.png)
